Explore Our Network of Sites
Search
By:

Data can be used to tell a number of different stories. But statistics from short periods of time are often unstable, if not unreliable. What we know is that in places committed to and producing better bike infrastructure, the number of people on bikes has increased across the board.
USA Today recently published an article suggesting that fewer Americans are biking to work than in the past. Much of the data from the article is drawn from the American Community Survey (ACS), an annual survey conducted by the U.S. Census Bureau to capture a demographic snapshot of American people including their primary means of traveling to work. While this survey provides a regular snapshot of how our communities evolve, the data offers a more limited view of U.S. transportation habits.
It’s true, at a national level, bike-to-work mode share — at least that measured by the U.S. Census — dropped for the first time since 2009 — from 0.69% in 2016 to 0.63% in 2017. However, this one year drop doesn’t necessarily indicate a trend unless we see the pattern continue over several more years.
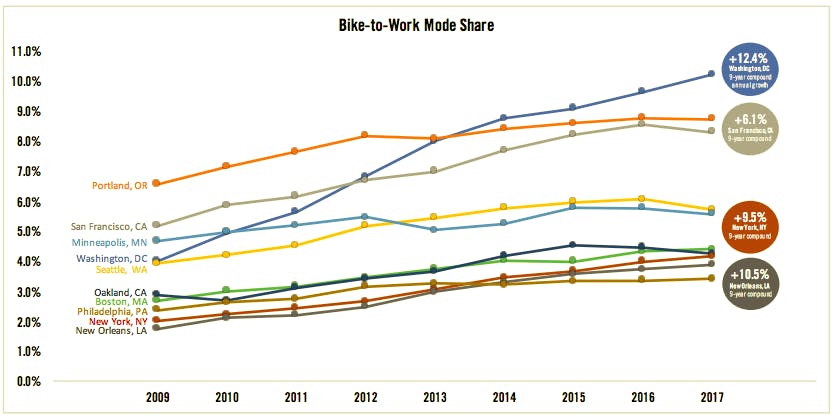
And the work occurring at the local level in the U.S. continues to impress. Even while half of the U.S. cities with the highest levels of bike-to-work mode share experienced the slight downturn revealed in the national data, biking to work has increased significantly in all 10 over a five-year period. And the nine-year trend is even more impressive.

NOTE: The graphic above uses 5-year estimates because the margin of error in the 1-year estimates is very high. We exclude those who use transit, walk, or work from home so as not to penalize cities with high levels of those modes.
In the cities that have invested in better bike infrastructure, without fail, bike commuting has vastly increased, and will continue to increase.
That said, it wouldn’t be a surprise to see continued declines in bike-to-work mode share on a national level. Stresses like an increase in miles driven, distracted driving, relatively inexpensive gas, and bigger cars all encourage driving and discourage biking, making our work as advocates even more important.
So what’s the secret to growing bicycle riding amidst these pressures? It’s simple. Building complete transportation infrastructure that connects biking, walking and public transit using safe designs for people of all ages and abilities to use. Complete networks connect and give access to destinations like work, school, and daily errands.
The real story is in communities like San Francisco, Washington D.C. and New York City where we’re already seeing changes in the way transportation networks function. Bike use at the local level is tied closely to investment in safe places for people to ride bikes. And the perception of safety goes beyond building protected lanes. In places where complete networks are being created, more people feel safe getting to where they need to go by bike.
It’s hard to criticize the consistency, availability, and comparability of the ACS data. After all, it’s the only multi-year data set we have available to understand biking participation. However, we should be cautious how we use the data and fully grasp the limitations of using the ACS as a sole source for identifying trends in biking. The ACS only measures the primary mode of travel, which means that if someone takes a bus and rides a bike the last mile, only the bus portion of the trip gets counted. Because it’s also based only on a small sample size, the data for any city has potentially huge margins of error, which can cause high degrees of variance year to year.
With this in mind, we’re working hard to establish a more complete understanding of bicycle riding in the U.S. Our City Ratings system offers a more holistic measurement of what’s going on in a community taking into account not only biking to work, but also recreational riding. Matched against other factors that influence bicycle riding like perceptions of safety, the quality of bike infrastructure, and how quickly communities are moving to make bicycle better, we’re able to more accurately assess bike riding for any city in the U.S. We also conduct an ambitious bike riding participation study: We’ve performed it three times and should be able to identify a clear trend line after we complete round four in 2020.
In every analysis, trends are established over time. That means looking at the bigger picture over a longer period to gain a better understanding of how transportation is evolving. We can accomplish this only by advancing the way we measure trips and modes of transportation. But most important, data measured with methods like our City Ratings can be used to help communities make improvements, and make them more quickly.