Explore Our Network of Sites
Search
By:

The PlacesForBikes City Ratings provide a data-driven picture of what it’s like to ride bikes in the US — with a focus on what we can do to improve the experience. We look at all aspects of bike riding: from safety, to how smoothly a bike network connects people to the places they want to go, to how much people want to ride.
We put together a few infographics to help illustrate the current state of bike riding in the US, examining both where we’re doing well, and identifying opportunities for improvement.
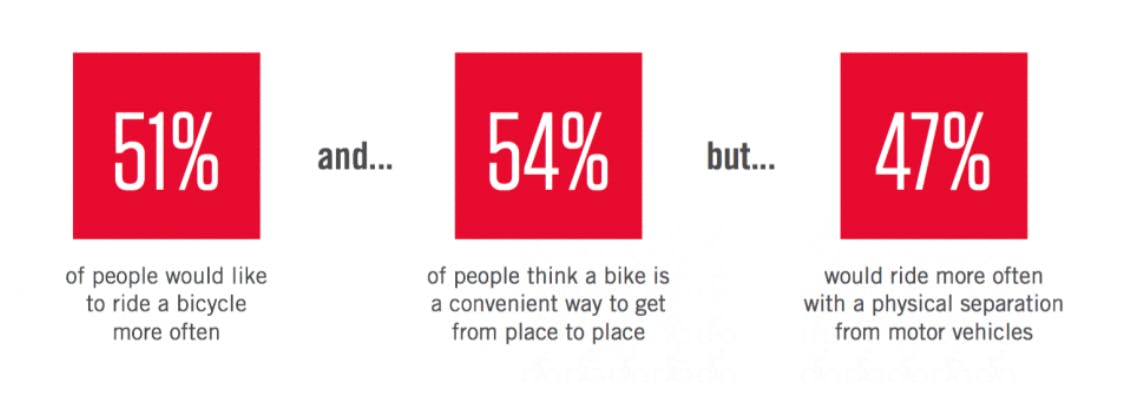
The ridership score reflects how many people in the community ride bikes, taking into consideration both recreational biking and biking for transportation. The US scored 1.4 out of 5. Americans want to ride bikes, but we have a lot of work to do to make bike riding experiences more appealing in every US community.

View the full infographic here.
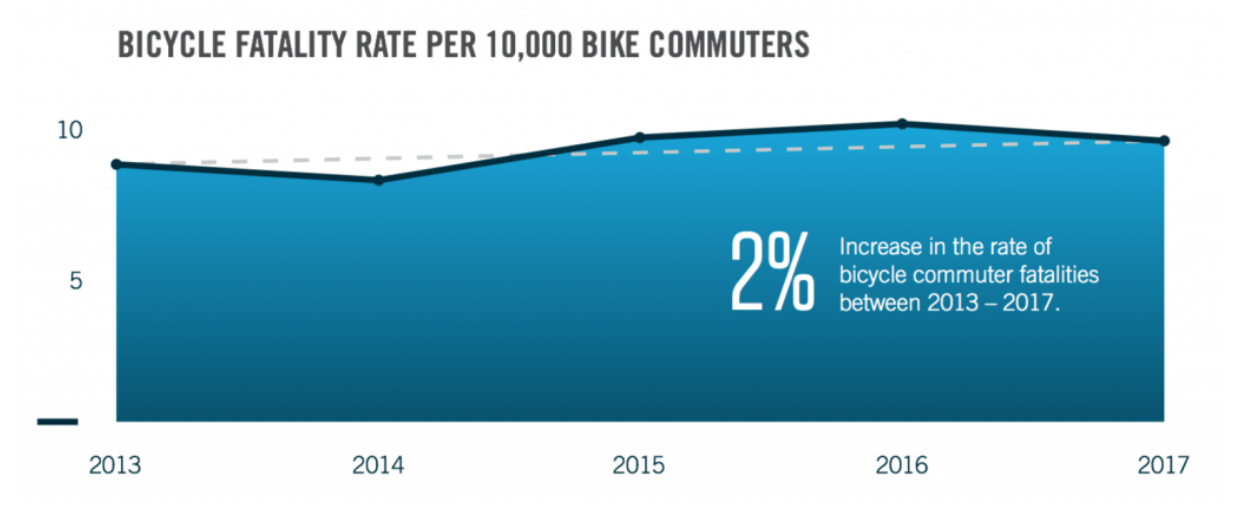
Safety is the biggest barrier that keeps people from riding bikes more often … or at all. The safety score considers how safe people feel when they ride, as well as fatality and injury rates of people on bikes, and those walking and driving. The US scored 1.6 out of 5 in this category.

View the full infographic here.
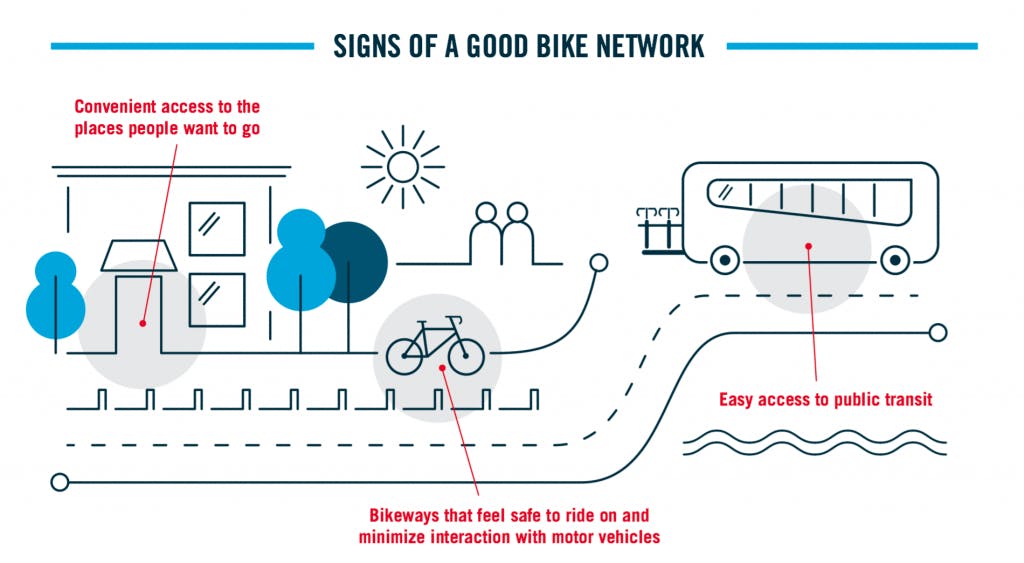
American want safe places to ride and aren’t satisfied with the bike networks in their communities. On a scale of 5, the US scored 1.8 on the network factor. This score evaluates the quality of the bike network — how completely it connects people to each other and local destinations using comfortable routes. It also considers whether people think they can get where they want to go by bike.

View the full infographic here.