Explore Our Network of Sites
Search
By:

Due to the constantly changing dimensions of the COVID-19 crisis, we encourage you to follow all current CDC guidelines as well as local travel advisories and recommendations. Take care of yourselves and loved ones. We’re all in this together.
When measuring and scoring Ridership, PeopleForBikes looks at two main factors: How many people are riding their bikes in a city, both for recreation and transportation, as well as how often those people are riding. Scoring well in Ridership is about creating great places to get on a bike, no matter what kind of riding it is.
Our method for measuring Ridership is unique in that it doesn’t penalize cities like New York or Boston for having high rates of public transit use and walking. Instead of measuring bike commuters as a share of all commuters, it compares the number of bike commuters to the number of car commuters. The method also accounts for a city’s land area so that cities like Indianapolis or Houston aren’t penalized for having far-flung city limits that include suburban neighborhoods (that increase the distance and challenge of commuting by bike). We measure Ridership based on three sources:
For Portland, getting more people on bikes means providing those people somewhere they feel safe and comfortable enough to ride — well-built, protected bike lanes. “For a long time, we believed a standard five foot bike lane would be enough to get anyone to ride a bike who would want to,” says Portland Bureau of Transportation Communications Director John Brady. “That standard is adequate but not great. For that reason, we started looking at how the world’s best bicycling cities, including Amsterdam and Copenhagen, build bike lanes. We also looked at what cities in Germany were doing to improve bike safety at intersections. We have taken what we learned and integrated those improvements into our network.” Protected bike lanes are now the default design when building new roadways or other infrastructure, Brady says, not an afterthought or exception. A good percentage of bike riding in the city takes place along the Willamette River, which includes the longest floating walkway/bike path in the U.S., as well as several protected river crossings for bicycles and pedestrians.
While safe bike lanes are a big part of Portland’s story, so is the city’s push to get people to use them. Sunday Parkways, started back in 2008, are one of Portland’s most popular public events that open up five to seven miles of city streets to walking and biking five times a year. “We design each route to introduce people to new Neighborhood Greenways and protected bike lanes,” says Brady. “We want to inspire Portlanders to turn every day into a Sunday Parkways day by biking not just for recreation on Sunday but also for transportation Monday through Friday.”
Ridership isn’t just about adults riding bikes, either. Since starting in 2005, Portland’s Safe Routes to School program has grown from eight initial partner schools to more than 100 partner schools across five school districts. Today, Portland students bike to school at eight times the national average. Brady says that if children can learn from an early age that bikes can be used for both recreation and transportation, riding a bike will become a habit that will stay with them for a lifetime.
Since installing its first on-street, protected bicycle lanes in 2007, New York City’s five-borough bike network has grown to more than 1,300 miles, including nearly 300 in Manhattan’s 23 square mile footprint, alone. “The combination of well-connected bicycle infrastructure, dense bike share stations and supportive land development help drive high ridership in the city,” says Alana Morales, deputy press secretary of New York City’s Department of Transportation.
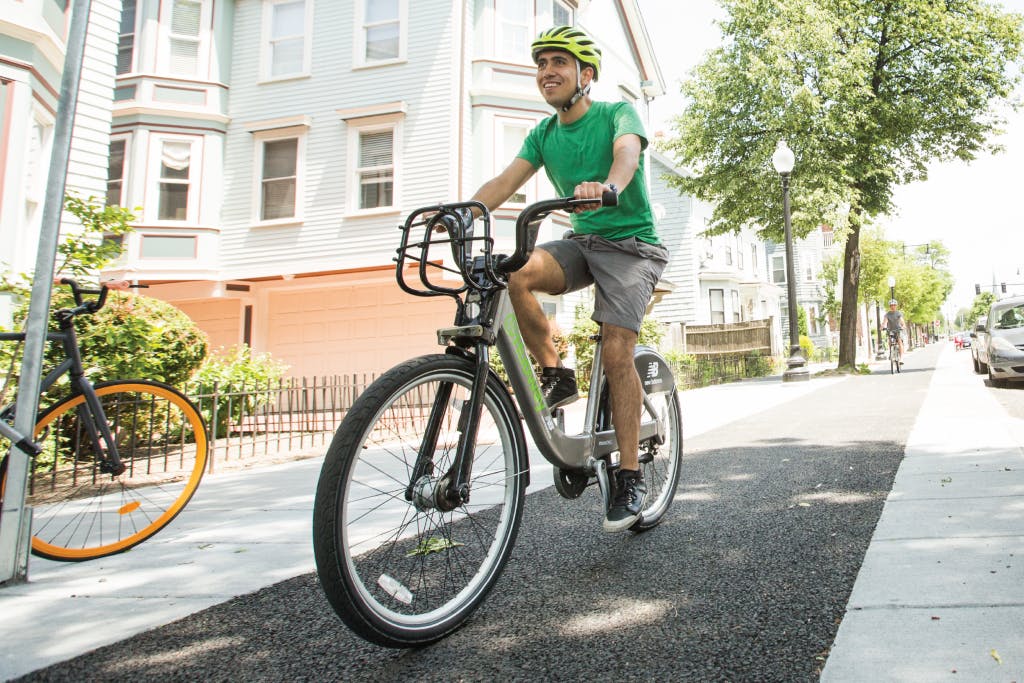
Since implementing the Citi Bike bike share program in 2013, with 6,000 bikes across 300 stations, New York City riders have taken 96 million trips with an average of more than 70,000 trips per day during the busiest times of year. The bike share system has since grown to more than 900 stations with 14,500 bikes.
During COVID-19, cycling numbers continue to rise for the Big Apple. “Bike share trips over the East River have increased 43% compared to pre-COVID-19 conditions,” Morales says. “Cycling is an important part of a resilient transportation system. It provides an alternative mode for getting around while still social distancing.”
Since 2006, the percentage of people who bike to work in Seattle has increased by 22%, while the number of people driving to work fell 14%.
Even more recently, Seattle has seen a bump in ridership numbers thanks to their Stay Healthy Streets initiative, which closed streets around the city to thru traffic, making it easier for residents to get outside, exercise and enjoy some fresh air while still keeping socially distant during COVID-19 lockdowns. Even as the city begins to reopen, Seattle has committed to making 20 miles of Stay Healthy Streets permanent.
“Now, more than ever, we must continue to build a more connected city with strong bike infrastructure,” says Seattle Mayor Jenny Durkan. “Our Stay Healthy Streets have helped our City stay active during the COVID-19 crisis and augment our 196 miles of bike infrastructure. We will continue to make investments in a city of the future that has safe, reliable transportation choices.”